From LCP to CLS: Improve your Core Web Vitals with Image Loading Best Practices

If you’re a front end developer, there’s a high probability you’ve built (or will build) an image-heavy page
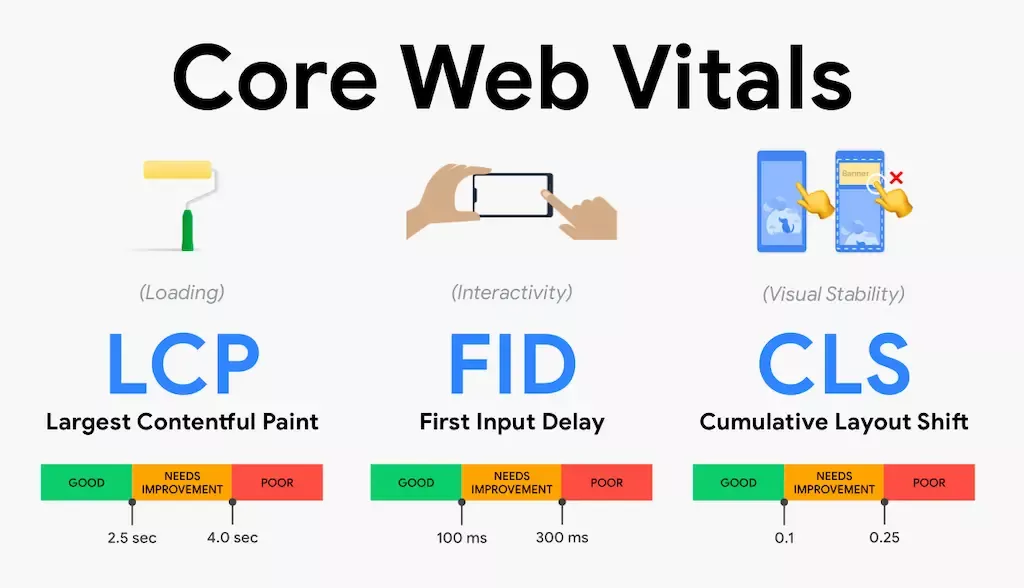
If you’re a front end developer, there’s a high probability you’ve built (or will build) an image-heavy page. And you’ll need to make it look great by serving high-quality image files. But you’ll also need to prioritize building a high-quality user experience by making sure your Core Web Vitals such as Cumulative Layout Shift and Largest Contentful Paint aren’t negatively affected, which also help with your search engine rankings.
In this post, we’ll learn about lazy loading, how lazy loading images can improve performance, user experience and Core Web Vitals, and how Sentry can help you monitor performance and diagnose issues with your web apps.
What is lazy loading?
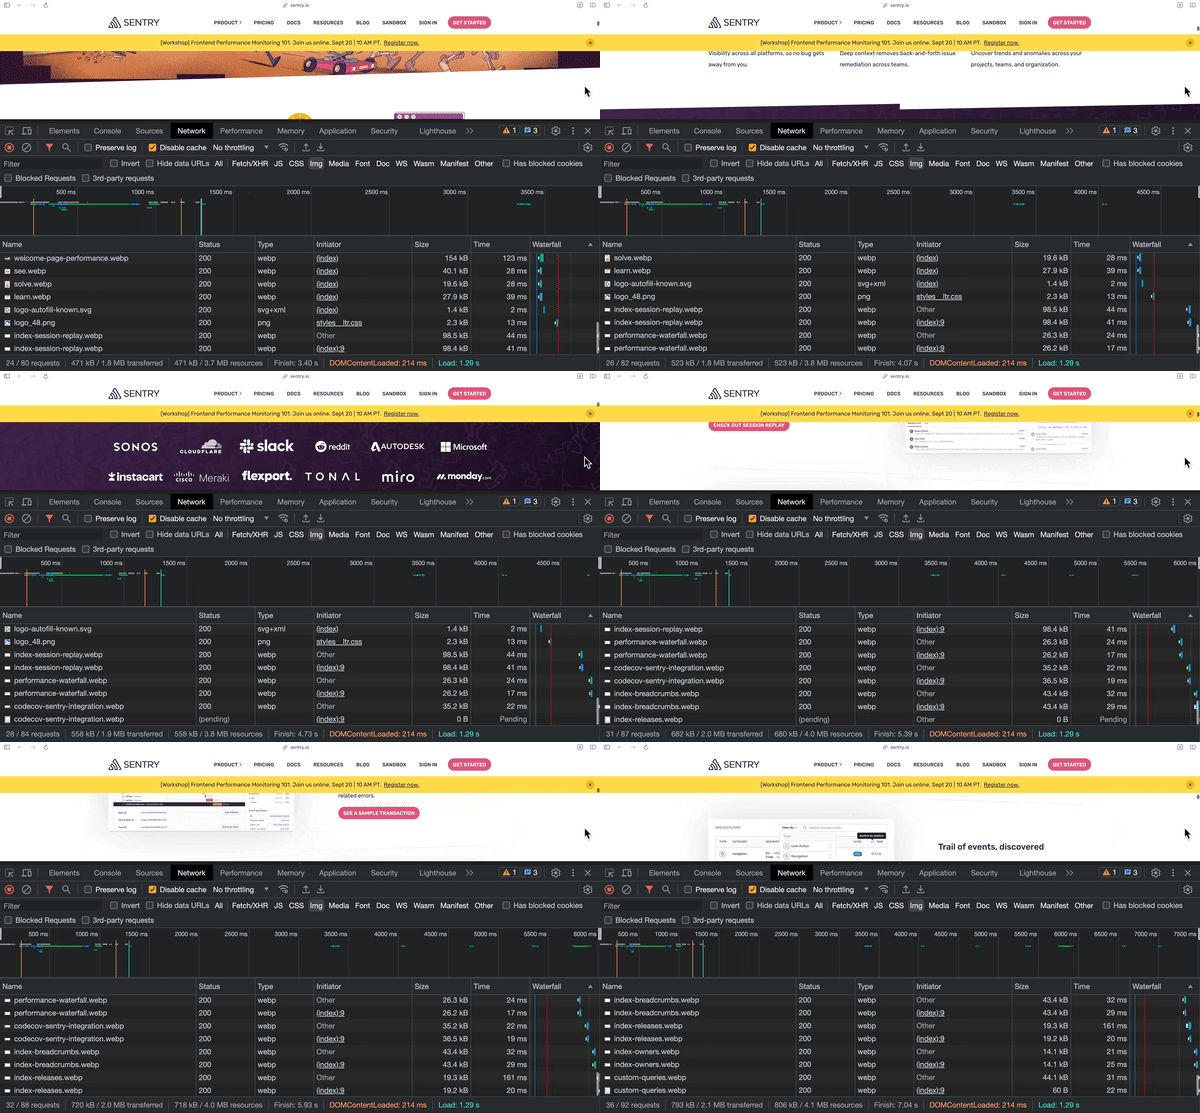
Lazy loading is a way to tell the browser to only load resources, such as images, when they’re needed. Great candidates for lazy loading are images that are not visible on page load, maybe they’re waaaay down at the bottom of the page. These images can be requested and loaded when a user scrolls an image into the viewport. This prevents forcing a user to download all images on page load, which could eat up their data allowances if they’re browsing on a mobile connection, and speeds up the perceived load speed of the page. The bottom line is, lazy loading makes things faster.
You can tell if a web page is using lazy loading on images by opening up the network tab in your browser dev tools. Filter resource type by img, reload the page, and scroll down. You’ll notice new network requests for images as you scroll. These images have been lazy loaded.
Browser support for lazy loading
The great news is that all major browsers support lazy loading for images, so you can be confident in implementing lazy loading in your web apps straight away. And some browsers even support lazy loading for iframes. You can find the current browser support for lazy loading on caniuse.com .
How to lazy load images
Lazy loading is configured by adding the loading attribute to any HTML img element, and setting the value to lazy. That’s it. This attribute instructs the browser to only load the image when it is visible in the viewport, shortening the Critical Rendering Path , and making your page load faster.
<img src="https://cdn.mywebsite.io/amazing_image.png"
     loading="lazy"
     alt="The most amazing image you've ever seen." />
The default value for the loading attribute is eager . You usually don’t need to specify this, but it’s often useful if your tooling automatically adds loading="lazy" by default, and you know that an image will be visible in the viewport on page load. And this leads us to a very important rule when considering which images to lazy load.
Don’t lazy load every image
Largest Contentful Paint (LCP) is the Core Web Vital that represents how quickly the main content of a web page is loaded, measuring the time from when the user requests the page until the largest image or text block is rendered within the viewport. If you lazy load images that are part of the LCP (often referred to as “above the fold”), they may begin loading after the layout confirms the image is in the viewport via the Critical Rendering Path , which is much later than they should.
Deciding which loading strategy to use for which images can get tricky depending on your responsive layouts and the myriad device and viewport sizes that exist today. Set Studio recently shared data which indicated there are over 2300 unique viewport sizes . Browsers may also have different thresholds that determine the distance from the visible viewport that an image should be lazy loaded. Chrome recently published an update to these distances in June 2023 .
Your first instinct might be to use JavaScript to detect whether an image is visible or not in the viewport on initial page load, and apply the lazy loading strategy after the fact. But you’d need to do this after the layout stage of the Critical Rendering Path, which is after the HTML has requested JavaScript that may alter the DOM in the first instance. This may slow your resulting page load and negatively affect your LCP score.
My recommendation would be to eagerly load a few more images than you might think will be visible in the viewport to account for such variety in viewport sizes. Combine this with loading the best image dimensions, resolutions and file types for that device and viewport size and you should be onto a winner.
How to prevent cumulative layout shift when lazy loading images
Have you ever accidentally clicked on a BUY NOW button after a rogue banner advertisement finally popped onto the page and moved everything around? Cumulative Layout Shift is when an element unexpectedly pops into view on a page, shifting the content around it. You might also see this happen when using custom fonts, and Lazar Nikolov provides great advice on how to prevent this in Web Fonts and the Dreaded Cumulative Layout Shift . Lazy loading images also comes with this risk — but thankfully there’s also a way to prevent it.
Add width and height attributes to your img elements to instruct the browser to reserve the correct ratio of space on the page in which to finally load your image when it scrolls into view. Add the height and width attributes to all img elements, regardless of whether they are lazy loaded or not. This will also minimize CLS during the LCP. Google advises that “to provide a good user experience, sites should strive to have a CLS score of 0.1 or less.”
<img src="https://cdn.mywebsite.io/amazing_image.png"
     loading="lazy"
     height=”1080”
     width=”1920”
     alt="The most amazing image you've ever seen." />
Why monitoring Core Web Vitals is bigger than periodic checks
Google takes into consideration your Core Web Vitals scores in search engine rankings, so you want to make sure your scores are within the limits specified for a good user experience. You might already be conducting periodic Google Lighthouse tests on your pages in development via your browser to check for performance issues such as CLS and LCP. And this is often good practice. But in reality, when working on large-scale applications such as ecommerce stores, you may be building templates that will generate thousands of pages in production. It’s unrealistic to check every page, for every internet connection speed, device type and viewport size.
Additionally, you might use automated Lighthouse testing in your CI/CD pipelines, configured to automatically fail deployments when test results fall below a specified threshold. But development teams are often expected to release many times a day, and adding time-consuming performance tests to your CI/CD processes can add hours onto release times. Not to mention the time it takes to triage a failed deployment, make changes, push new code, run CI/CD again, rinse and repeat.
You need an efficient way to monitor the performance of every page of your application that doesn’t add hours to development time, doesn’t block releases, and only alerts you to the issues that matter. Because, let’s be honest, you’re not doing this every time. But Sentry can actually fix this!
How to monitor performance impacts of lazy loading
You’ve implemented lazy loading and you are now able to set up monitoring to confirm it has improved the performance of your site, without having to manually check dev tools every few weeks. Sentry’s JavaScript Browser SDK automatically collects all Core Web Vitals, and you also have the ability to send your own custom metrics to Sentry, such as memory usage and component render times. When initializing Sentry in your code, include the BrowserTracing integration so that a new transaction gets created in Sentry for each page load and navigation event.
With BrowserTracing enabled, you’ll see transactions start to fill up your performance dashboard .
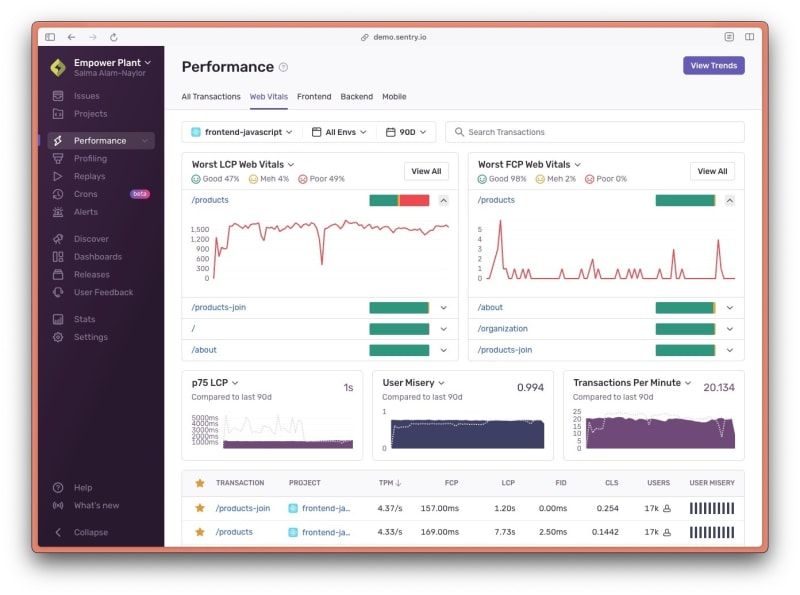
Luckily, our own tool helped bail us out here. We use Sentry performance monitoring to monitor the performance of Sentry performance monitoring. And with these huge insights into how Sentry was performing for users, the team were able to identify that lazy loading release and health data separately, but in parallel, led to a 22% faster UI and almost half a second faster load time . We also encountered a similar issue on the Sentry home page , which serves over 150 images. We used our own performance monitoring to learn that we needed to implement lazy loading on all images that were not part of the LCP.
How to alert your team when your Core Web Vitals are miserable
So you don’t have to spend hours and hours painstakingly triggering manual Lighthouse tests — or add hours to your deployment processes with CI/CD testing, you can configure alerts in Sentry to let you know when your users are experiencing poor performance.
Create a new performance alert, configure the metric, alert thresholds, and actions you want Sentry to perform. What’s more, by monitoring errors and performance in Sentry, you’re getting insights and alerts based on what real users are experiencing on the pages that they’re visiting – not just data from the tests you run yourself.
In this example, I set up a critical alert to fire and notify me by email when the average LCP for all site pages exceeds 3 seconds in the space of one hour. (Google recommends sites should maintain an LCP score lower than 2.5 seconds to provide a good user experience.) This is a great way to monitor release health . Should a change go out that negatively affects the average LCP, Sentry will notify me within the hour.
View the interactive example on Arcade .
Wrapping up
Acing your Core Web Vital scores is crucial in providing a good user experience and pleasing the Google machine. Lazy loading images until they are visible in the viewport is a useful way to shorten the Critical Rendering Path, speed up perceived page load for users and improve your Largest Contentful Paint score. Ensure you add width and height attributes to image elements to prevent Cumulative Layout Shift for lazy loaded images, and always be mindful of different device sizes and viewport widths when deciding which images to lazy load. Monitor your Core Web Vitals and overall performance with Sentry, and set up alerts for critical performance issues without sacrificing development time or CI/CD resources.
Check out the docs pages to learn how to set up performance monitoring in your applications, and we’d love to hear from you in the Sentry Discord about how Sentry has helped you solve performance issues in your apps.
