Continous Profiling with Grafana Pyroscope

If I asked you now, what are the most effective methods for finding performance bugs? You probably...
If I asked you now, what are the most effective methods for finding performance bugs? You probably thought about log analysis, conducting continuous performance tests, or application monitoring. But what if I told you there's something else called continuous profiling?
Profiling vs Continuous Profiling
Let's start by explaining what profiling is. It involves analyzing how a program consumes resources such as CPU or RAM at code-level granularity. Profiling is often visualized using a flame graph, which we'll discuss in a moment.
The second method of profiling is continuous profiling. It involves profiling code over a period of time. This allows us to more effectively find, debug, and fix errors related to application performance.
Profiling with a Live Example
To better illustrate the profiling process, let's create a simple example in Python.
from time import sleep

def main():
 subFunc()
 secondSubFunc()

def subFunc():
 sleep(1.3232)

def secondSubFunc():
 thirdSubFunc()

def thirdSubFunc():
 sleep(0.429)

main()
Then, let's run the script in the console.
gpiechnik> python3 -m cProfile script.py

 9 function calls in 1.761 seconds

 Ordered by: standard name

 ncalls tottime percall cumtime percall filename:lineno(function)
 1 0.000 0.000 1.761 1.761 test.py:1()
 1 0.000 0.000 0.431 0.431 test.py:10(secondSubFunc)
 1 0.000 0.000 0.431 0.431 test.py:13(thirdSubFunc)
 1 0.000 0.000 1.761 1.761 test.py:3(main)
 1 0.000 0.000 1.329 1.329 test.py:7(subFunc)
 1 0.000 0.000 1.761 1.761 {built-in method builtins.exec}
 2 1.761 0.880 1.761 0.880 {built-in method time.sleep}
 1 0.000 0.000 0.000 0.000 {method 'disable' of '_lsprof.Profiler' objects}
In the console, the invocation of all functions in sequence is displayed. In this way, we can easily identify which parts of our code are the most time-consuming. In the provided profiling report, we see exactly how much time each function took, which is key to understanding the performance of our program.
For example, in the above example, subFunc() took the most time, about 1.329 seconds, which is due to the call to sleep(1.3232) . Meanwhile, thirdSubFunc() , calling sleep(0.429) , took less time, about 0.431 seconds. Importantly, the execution time of each function ( tottime ) and the cumulative time ( cumtime ) give us a comprehensive picture of where delays occur in our code.
Analyzing this data, we can make decisions about optimization. For instance, if subFunc() is critical to the performance of the entire system, it would be worth considering reducing its execution time or applying alternative methods.
Flamegraph
Let's run the Python script from the previous example with an additional argument.
python3 -m cProfile -o profile_output.prof script.py
In this way, a file named profile_output.prof will be generated. Then, using the flameprof library, let's convert it into an SVG format.
flameprof profile_output.prof > profile_output.svg
In this way, a file will be generated that holds the representation of our profiling in the form of a flame graph.

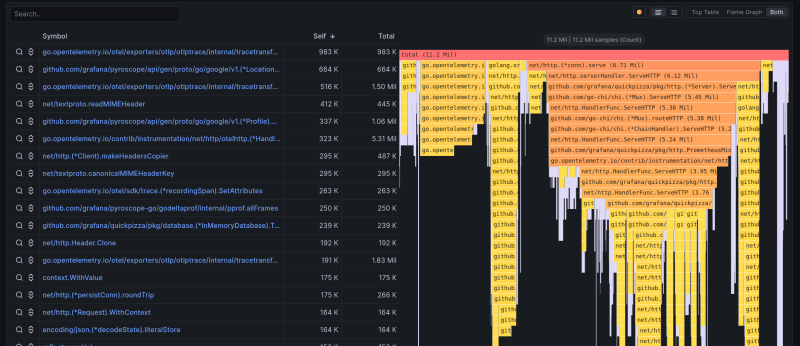
Flame graph is a visualization tool used to present software profiling data, which shows in detail which parts of the code consume the most CPU time. It is a very useful form of presenting profiling data, especially in the context of identifying "bottlenecks" in applications.
How to analyze a flame graph? There are a few things we should know.
- Hierarchical Structure: Flame graph presents function calls in a hierarchical form, where each layer represents a function. At the bottom are the "root" functions, and above them are those that are called by them.
- Width of Blocks: The width of each block (representing a function) is proportional to the time that function consumed. The wider the block, the more CPU time was devoted to that function.
- Coloring: Blocks are usually colored randomly to make it easier to distinguish individual functions. However, the color has no semantic meaning.
Inverted flame graph
Reading about flame graphs, we can also come across the concept of an inverted flame graph. It is used to visualize the total time of all calls of a program, reversing the traditional structure of the flame graph so that the root is at the top and the leaves at the bottom. This reversed perspective allows us to quickly identify the functions that contribute the most to the overall execution time, facilitating performance analysis and code optimization.

Grafana Pyroscope
Profiling and system observability are two key elements in managing the performance and stability of applications. Profiling allows for a deep understanding of which parts of the code are the most resource-intensive or cause performance issues. Observability, on the other hand, provides a broader context of the entire system's operation, helping to identify how these problems affect the overall activity of the application.
Pyroscope is an example of a tool that combines these two areas. As a real-time performance profiling tool, Pyroscope provides detailed information about the resource usage of applications. Moreover, integrating Pyroscope with monitoring and alert systems allows for a better understanding and response to performance issues in the context of overall system observability.

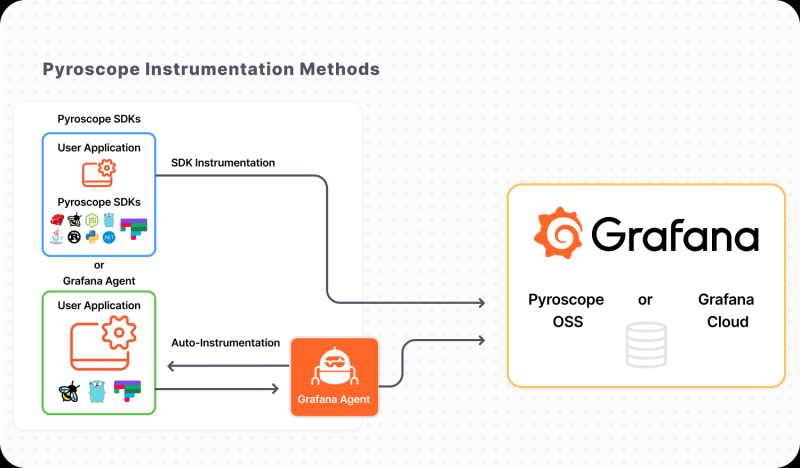
Grafana Pyroscope operates in two modes. The first involves using the SDK and sending data to the Pyroscope server. The second involves using Grafana Agent or another collector to gather information about the application. This is done through endpoints exposed by the application or eBPF. We will discuss eBPF itself in later parts.
At this point, it is important to note that direct instrumentation of the application itself is not necessary to gather profiling information.
UI Overview
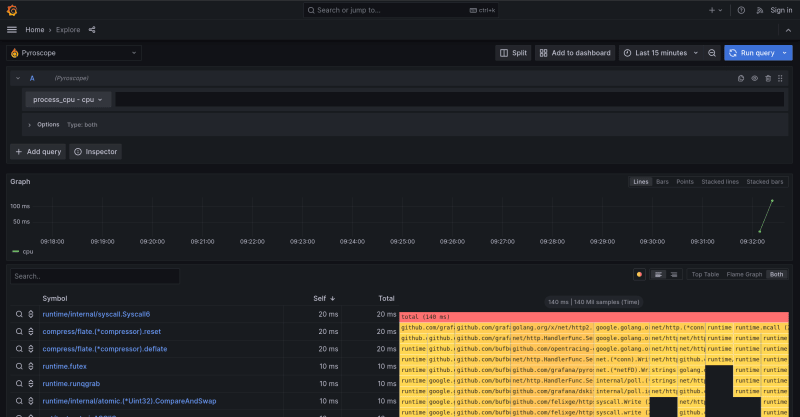
In practice, Grafana Pyroscope consists of three parts. Let's take a look at each of them in turn. For this purpose, we will locally launch the quickpizza project from the Grafana Labs repository. It includes, among other things, the Pyroscope tool dockerized.
After entering Grafana on localhost at port 3000 and going to the Explore tab, we are able to explore Pyroscope.

Query
The first component of Pyroscope is Query. It allows users to formulate queries to the collected data to obtain detailed information about the performance of the application. This enables the user to precisely identify areas of the code that require optimization or are potential bottlenecks in the system.
Query plays a central role in the entire interface, as the data presented on the chart and in the combination of flame graph with the table depend on the selected metric. Typically, the default metric is CPU usage.

Resource Usage Over Time
The next part of Pyroscope is "Resource Usage Over Time", which plays a fundamental role in monitoring and analyzing how an application uses resources over time. This feature allows for the tracking of CPU usage, memory, and other key system resources, providing users with a clear picture of their application's impact on the server or runtime environment. With this tool, developers can observe resource usage trends, identify patterns that may indicate inefficiency, and respond to potential performance issues.

Flamegraph and Table
The last elements are the Flamegraph and the table. The first part, the Flamegraph, is already well-known to us. The second part is a representation of the data from the flame graph in table form. Since these are non-graphical data, it is possible to easily sort them based on resource usage.

Summary
Just like traces, logs, and metrics, we should not ignore profiling as an integral part of analyzing and detecting performance issues in applications. Grafana Pyroscope is a powerful tool that can be easily used in a project at a minimal cost.

